MEASURE SATISFACTION AND TAKE ACTION
There are two main areas where satisfaction level collection is implemented:
at the exit and in the self-service area.
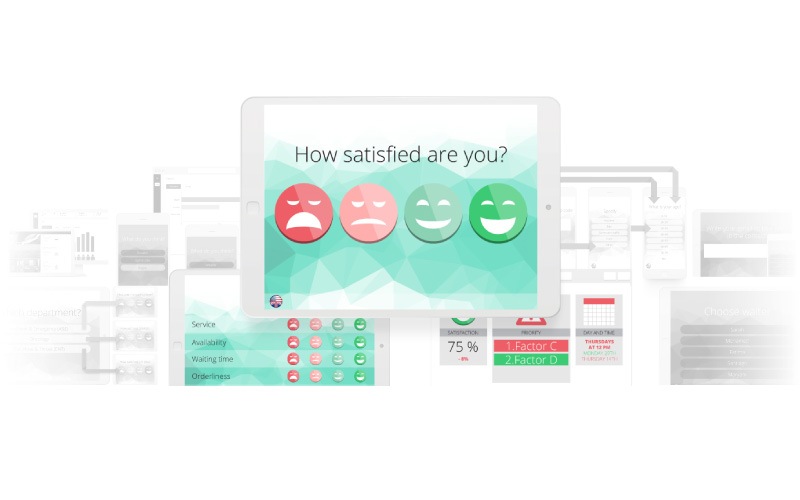
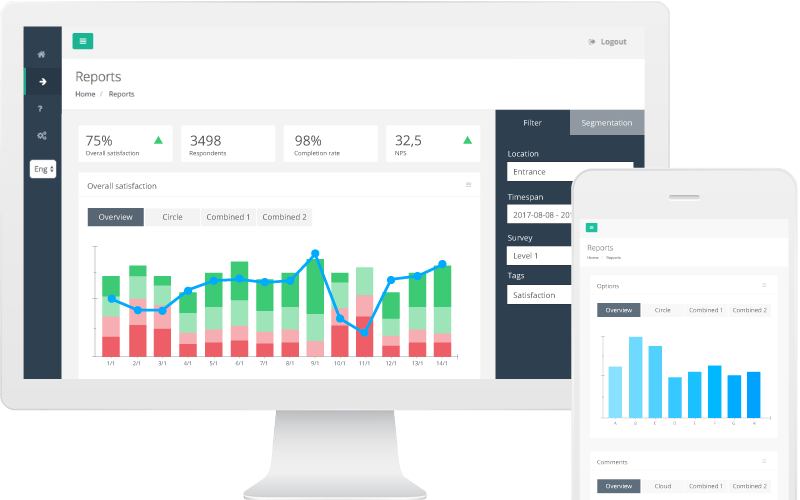
First let’s look at the question asked at the exit: “How satisfied are you with your visit?” To this question there is a page two, in the survey, added where the optional factors are rated. The average percentage of people who are willing to complete the two pages is 42% of the total group surveyed. Compared to a survey that only has one question, a GreatRate survey gets much more actionable data and leaves all respondents happy with the survey experience. The factors in this case are: value for money, product quality, clean and tidy, staff service and easy to find what you are looking for. Supervisors follow trends every day, and once a week they follow the action plan sent to their email. They show the action plan to the staff, and it clearly points out the factor to focus on that week.
Sometimes they want to know more details about how they should improve a factor. Either they change the survey that week or start a parallel survey that alternates on the ground. This new survey is equally quick and enjoyable to answer, with one general question and 3-5 factors. They often do this the last week of each month.
Let’s look at two examples:
– When they decide to explore customer satisfaction with staff, the first question is: “How satisfied are you with the staff?” (Sometimes added with “in this department?”). The factors are: availability, attention paid to you, service, usefulness and knowledge of your question. The analysis and action plan pinpoint the factor to focus on, making staff work on the right things to increase overall satisfaction.
– When they need to focus on how easy it is to find the right products, the first question is: “How easy is it to find what you came here to buy?” (Sometimes added with “in this department?”). The factors are: sufficient information about the product, staff availability, waiting times and the product is in stock. Analysis points staff in the right direction.
To add to the understanding, clients can write in their own words what they want to improve.
In the self-service area, the factors are: Easy to find your product, Easy to carry your product, Availability of staff and The products were in stock. In this specific case, the analysis clearly shows that the main priority is to find your product easily, which provides improvements in visualization and information on where to find the products.
HOW TO REDUCE COST AND MAKE SHOW ROOMS MORE ATTRACTIVE
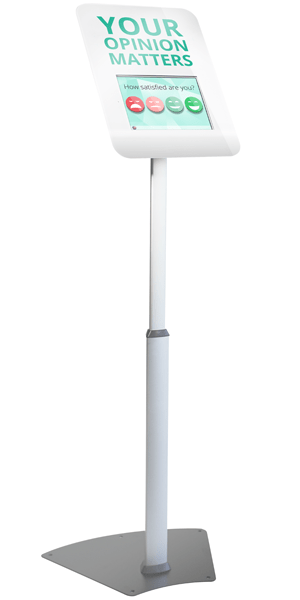
Let’s look at the surveys conducted in the showrooms. They use the same method with a general question and optional factors, but a floor stand is placed in each showroom. Analyzing factors such as Smart Solutions, Style, Storage, Environmental Thinking and Lighting, it was concluded that the most important factors for overall improvement in showrooms were Smart Solutions and Style. Except in the bedroom where storage had a much bigger impact.
Following these findings, the team responsible for showroom construction has greater knowledge of how to build showrooms that speak to customers and make them more likely buyers.
These findings, and very specific data analyzed, have never been seen before in the IKEA organization.
OTHER USES
In a specific case about awareness about services, they asked the question: “How well do we inform about our services?” The factors were: Financing, Help gathering goods, Home transportation, Kitchen/bathroom installation, and Interior decoration. Information and awareness about Financing had to be improved.
