CUSTOMER
COMMENTS

FOR RETAIL, TRANSPORTATION, GOVERNMENT, EDUCATION, TOURISM AND MORE

International Clients

Local Clients

PLATAFORMAS DE CLIENTES POPULARES

QUIOSCO DE SUELO
ENCUESTAS DE EMAIL
PAQUETE BRANDING
MEDIOS DE COMUNICACIÓN SOCIAL

COLLECT QUICK FEEDBACK

FEEDBACK IN 8 SECONDS

WITH IMPACT ANALYSIS AND ACTION PLAN
In order to increase satisfaction, you need to know why respondents are happy or unhappy. In eight seconds you will get overall satisfaction and ratings for your chosen factors. Is it, for example, service, waiting time or availability that needs attention? The second page is optional to give all respondents a positive survey experience (and to continue giving feedback when they return) and with this approach, on average they will get 50% of the detailed ratings that will be analyzed in depth. This unique GreatRate method automatically sends ready-to-use action plans to the staff meeting. Point out which factor has the highest priority at the moment. There is no need for interpretation, take action.

NET PROMOTER SCORE

TENDENCY TO RECOMMEND
In addition to the single GreatRate method described above, another popular scale is the Net Promoter Score (NPS). It asks the question “How likely are you to recommend us to a friend or colleague?” The scale is 0-10 and only the first 9 and 10 are considered positive. This makes NPS a powerful way to ensure that the results show people who would actually recommend your brand. This method works well if NPS is your current standard. In most cases, we recommend that you use this in combination with the deeper analysis that GreatRate allows, for example with more specific factor rankings.

SEGMENT AND CHANGE CONTENT

GIVE SEPARATE GROUPS THEIR OWN SURVEY PATH
GreatRate can be adapted to different environments where feedback is collected from different target groups. You can use simple segmentation to give different surveys to each target group. Or you can use more advanced question logic where a specific question is shown only to respondents who meet a required pattern of answers. For example, you can let dissatisfied respondents clarify their experience. In any case, the management system gives you full control and overview over the different routes.

ACTIONABLE VISION

RESULTS AND ANALYSIS

CLOUD-BASED MANAGER WITH POWERFUL SEGMENTATION
Reach all data instantly in the fast and flexible cloud-based manager, wherever you are, on your computer or mobile device. Create surveys with ease and use our wide range of graphs to view the results. The segmentation panel allows you to choose the correct time range, collection point, and survey. You can even use each option in the survey to filter the results. For example, you can show responses specifically from dissatisfied respondents. An adaptable hierarchy will work for any size team, and user-specific access provides the structure your team needs.

REPORTS AND EXPORT

ACTION PLANS AND AUTOMATIC REPORTS
Our reports are carefully designed to meet your needs. The most powerful report on the market is the action plan that uses deep analysis to interpret the results for you and present effective priorities. This one is especially suitable for introducing your team, participating and taking action. Automatic daily, weekly, monthly and yearly reports can also be used for quick summaries. The export features are vast, and it allows you to segment the results any way you like. You can also choose between different file types, such as Excel, PDF, and CSV, depending on whether you will present them out of the box or integrate with other systems.

WHY CUSTOMER FEEDBACK?

La satisfacción del cliente, la lealtad y la experiencia es la máxima prioridad en la mayoría de las empresas y organizaciones. Desea que los clientes lo visiten de nuevo, esté encantado de pagar más por sus productos o servicios, elija usted aunque sea un camino más largo y recomiende su marca a otros. Las claves más importantes para tu éxito There are big changes happening. Today we see much more interest in what customers think, feel and act. Why is that? There are many changes underway in the market and even in our society. To mention a few, we can start with communication. The network that each person has now extends beyond thousands and sharing an opinion now reaches much further than ever. This is a fundamental change, and even more important because a negative opinion share has 12 (twelve!) times the effect of a positive opinion share. It can lead to disaster. What about dissatisfied customers who are less talkative but still walk out the door and never come back? They are a big loss, since it costs up to 7 (seven!) times more to acquire new customers than to retain the ones you already have. So how are you going to keep them loyal enough to come back?
The products look increasingly similar. Prices are already very low in many markets. You need to focus on keeping them happy with their experience, and you have plenty of opportunities to influence that. How you handle service, wait time, information and other factors will be crucial to success. Another vital change is the speed of information. Annual and monthly surveys belong to the past. Today information is about being updated here and now, and for that there is a need for better, faster and more intuitive collection points to easily understand the situation. Waiting too long to hear important feedback or see the effect of your changes will only increase customer churn. So what can you do? You need more than revenue numbers, traffic analytics, and other KPIs. Be better informed about customer satisfaction and make better decisions. And don’t expect useful information, revenue numbers and compliance goals depend on it. Bring clarity to what needs attention right now. Our users say that when you get evidence of a negative impact, even if you already imagine it, you dare to act and achieve your goals faster. And sometimes the idea will be new: the most precise tool to stay ahead of your competitors.

YOU ARE IN GREAT COMPANY

CASE STUDY

Type: retailers
respondents: 17,768/month completion rate: 42%
“As a store manager at IKEA, I came across different customer research tools throughout my career, but GreatRate differs from everything else. “It is the only tool that comes with a complete priority analysis, which makes all the difference!” MARTIN LIABÄCK (FMR.) STORE MANAGER
CUSTOMER CASE: IKEA
IKEA is the world’s largest furniture retailer. With a large number of visitors each day, keeping up with their opinion can be a challenge. In an IKEA store, customer experience is everything. From the moment you park the car, until you have pulled out and left the area, every step is important.
IKEA uses GreatRate for two main purposes. 1. Measure satisfaction level and get instant knowledge on how to increase or maintain it. 2. Lower showroom construction cost and increased sales with analysis of what customers rank as most important to focus design on. For these two purposes, the platform kiosk was chosen to capture customer feedback on the go.
MEASURE SATISFACTION AND TAKE ACTION
There are two main areas where satisfaction level collection is implemented: at the exit and in the self-service area. 
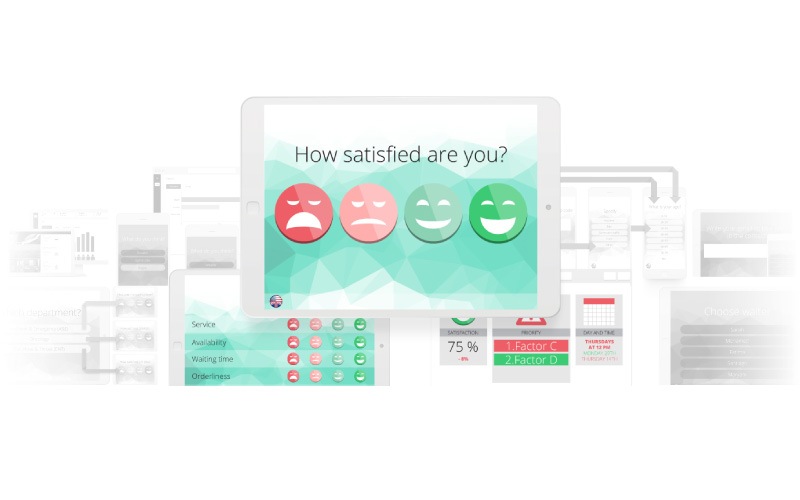
First let’s look at the question asked at the exit: “How satisfied are you with your visit?” To this question there is a page two, in the survey, added where the optional factors are rated. The average percentage of people who are willing to complete the two pages is 42% of the total group surveyed. Compared to a survey that only has one question, a GreatRate survey gets much more actionable data and leaves all respondents happy with the survey experience. The factors in this case are: value for money, product quality, clean and tidy, staff service and easy to find what you are looking for. Supervisors follow trends every day, and once a week they follow the action plan sent to their email. They show the action plan to the staff, and it clearly points out the factor to focus on that week. Sometimes they want to know more details about how they should improve a factor. Either they change the survey that week or start a parallel survey that alternates on the ground. This new survey is equally quick and enjoyable to answer, with one general question and 3-5 factors. They often do this the last week of each month. Let’s look at two examples: – When they decide to explore customer satisfaction with staff, the first question is: “How satisfied are you with the staff?” (Sometimes added with “in this department?”). The factors are: availability, attention paid to you, service, usefulness and knowledge of your question. The analysis and action plan pinpoint the factor to focus on, making staff work on the right things to increase overall satisfaction. – When they need to focus on how easy it is to find the right products, the first question is: “How easy is it to find what you came here to buy?” (Sometimes added with “in this department?”). The factors are: sufficient information about the product, staff availability, waiting times and the product is in stock. Analysis points staff in the right direction. To add to the understanding, clients can write in their own words what they want to improve. In the self-service area, the factors are: Easy to find your product, Easy to carry your product, Availability of staff and The products were in stock. In this specific case, the analysis clearly shows that the main priority is to find your product easily, which provides improvements in visualization and information on where to find the products.
HOW TO REDUCE COST AND MAKE SHOW ROOMS MORE ATTRACTIVE
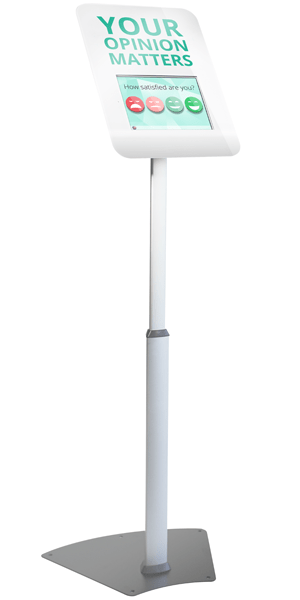
Let’s look at the surveys conducted in the showrooms. They use the same method with a general question and optional factors, but a floor stand is placed in each showroom. Analyzing factors such as Smart Solutions, Style, Storage, Environmental Thinking and Lighting, it was concluded that the most important factors for overall improvement in showrooms were Smart Solutions and Style. Except in the bedroom where storage had a much bigger impact. Following these findings, the team responsible for showroom construction has greater knowledge of how to build showrooms that speak to customers and make them more likely buyers. These findings, and very specific data analyzed, have never been seen before in the IKEA organization.
OTHER USES
In a specific case about awareness about services, they asked the question: “How well do we inform about our services?” The factors were: Financing, Help gathering goods, Home transportation, Kitchen/bathroom installation, and Interior decoration. Information and awareness about Financing had to be improved.

DO YOU HAVE ANY QUESTION?

Find us on: