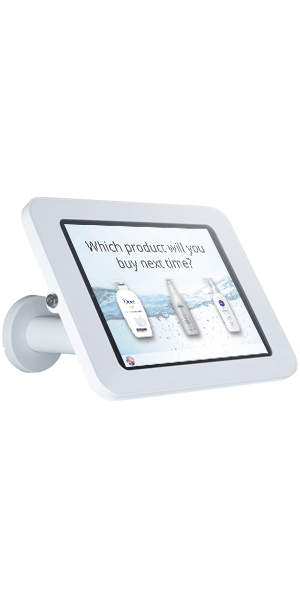
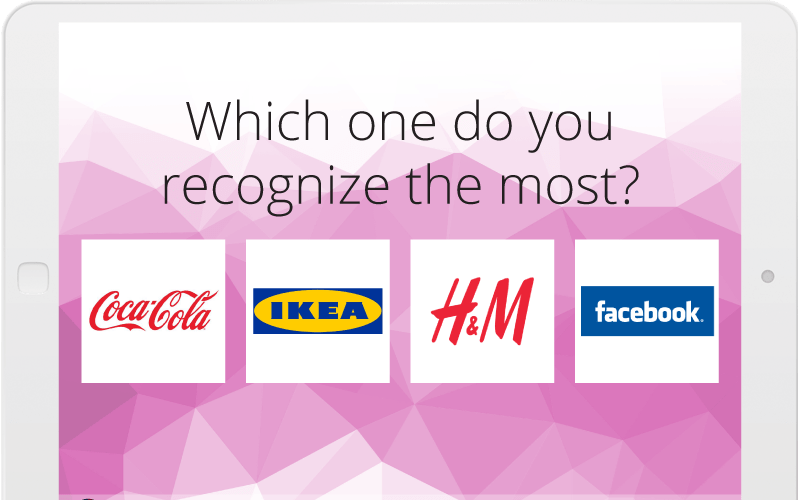
Which brand do you recognize the most? Which product should we add to our assortment? Who will you vote for? Which color should we paint on this wall? Whatever you can think of – we have a question type that suits you.
Upload any picture to your image library and let the respondents pick one or more options. You can even create your own rating scale by adding values to your images. You can also add a caption to each question to explain its meaning.
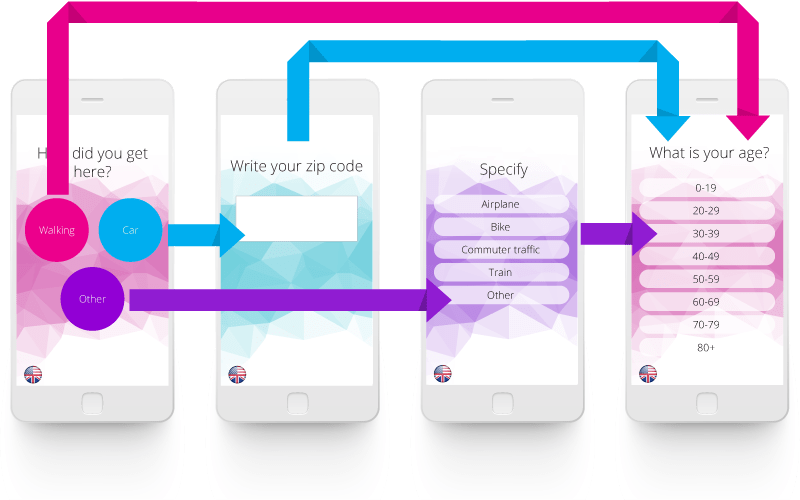
Adapt the survey the way you like it. Depending on the last answer, or even answers earlier than that, you can show a specific question for that respondent.
This kind of advanced question logic makes it possible to collect a vast range of answers without taking too much time for each respondent. Use our different question types to collect vital information about your respondents. The possibilities are far greater than fits in this text.
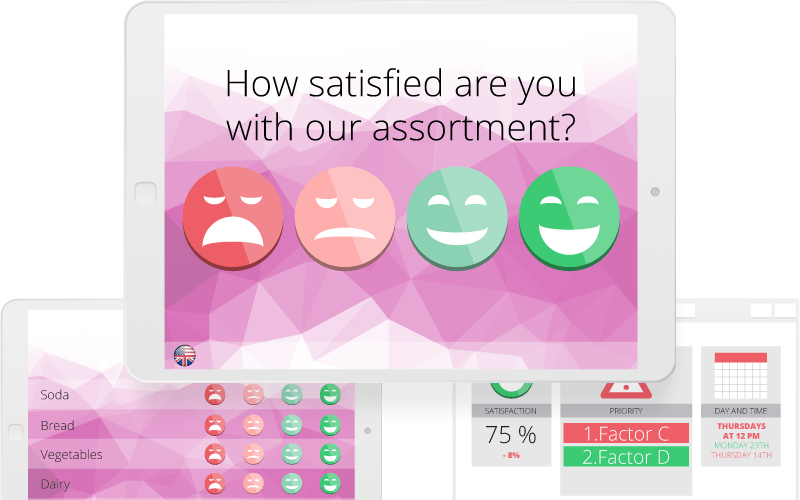
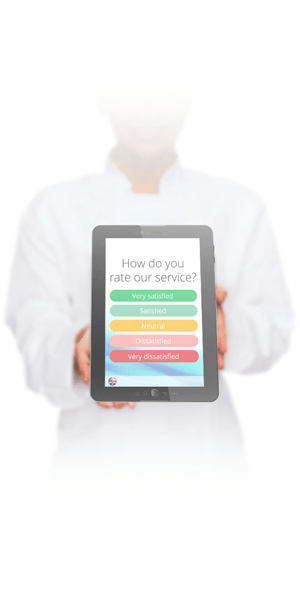
The unique GreatRate method is perfect for focusing on a specific field and solving a specific problem. In only eight seconds you can dive down into questions like what products need improvement or what impacts a certain experience.
Since the second page is optional the respondent stays positive to the survey. This way you can use this method both short term and long term. Either to solve a problem right now or to follow up an ongoing survey. The action plan helps you act instantly without needing to interpret the analysis.
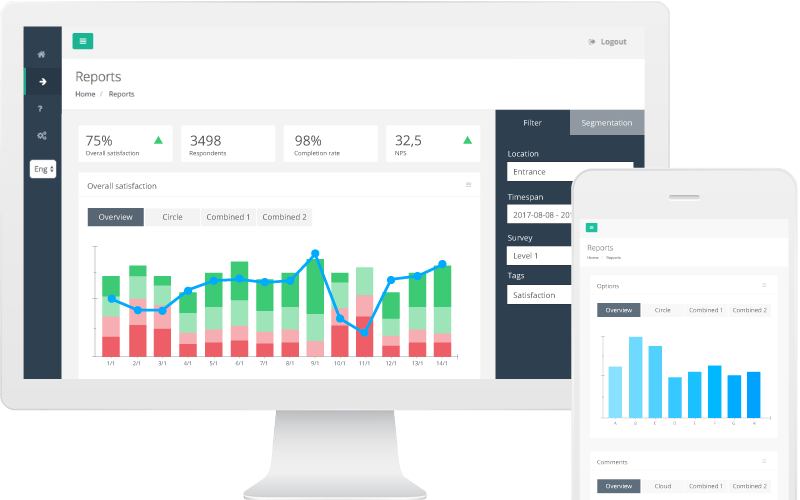
Reach all data instantly in the fast and flexible cloud based admin – wherever you are, on your computer or mobile. Create surveys with ease and use our vast range of charts to view the results.
The segmentation panel lets you pick the correct time span, collection point and survey. You can even use each option in the survey to filter the results. For example you can show answers specifically from dissatisfied respondents. An adaptable hierarchy will work for any team size and the user specific access gives the structure your team needs.
Our reports are carefully designed to suit your needs. The most powerful report on the market is the Action plan that uses deep analytics to interpret the results for you, and present effective priorities. This one is especially suited for presenting to your team, engaging and taking action.
Automatic daily, weekly, monthly and yearly reports can also be used for quick summarizes.
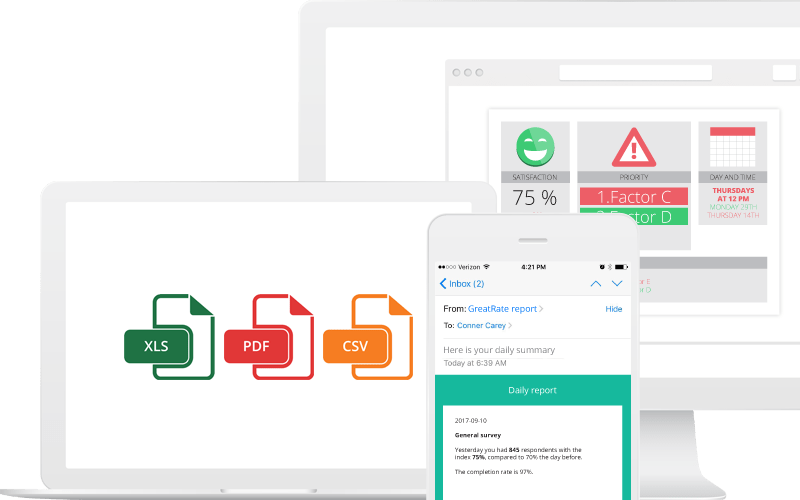
The exporting functions are vast, and let’s you segment the results the way you like it. You can also choose between different file types, such as Excel, PDF and CSV depending on if you will present them right away or integrate with other systems.
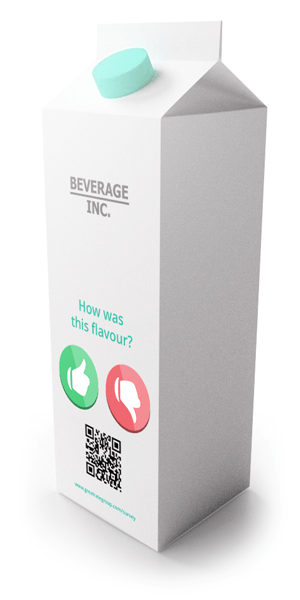
For guests at a hotel or a restaurant the experience and satisfaction will determine if they will come back and recommend the brand to others – core goals of the business.
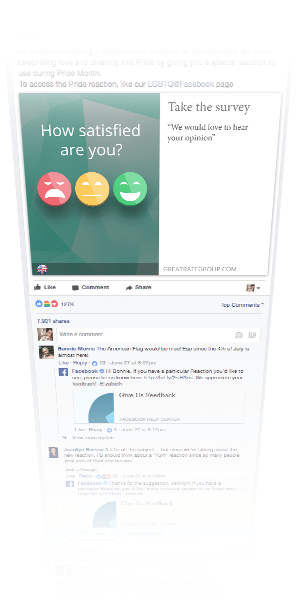
Some won’t share any opinion, others will speak their mind on social media and give ratings on different platforms. You want good opinions and ratings to be spread, but unless you collect the feedback directly at the point of experience and systematize the improvements there is little value to all those opinions. They are either never shared, too spread out over different channels or too mixed and imprecise.
There are many opinions walking out the door that could have been collected instantly. If you make it easier to give feedback more will tell you what they feel and why – and you can get much more analyzed, precise and instant knowledge of what your guests want.
With instant feedback, and the GreatRate system helping you decide what to focus on, you can adapt the questions and strategies specifically for your current needs.
You can start with reports that tell you clearly what factor needs attention – for example cleanliness, staff service, availability or atmosphere. After that you can dig deeper – is it for example more friendliness or professionalism the guests wants from your staff? We give you the power to get deeper insight than other feedback platforms.
Hotels and restaurants have many suitable collection points, be it in the lobby, on the smartphone or at the table along with the check. Take advantage of this. And also – take advantage of the positive feedback that lets you know the reason your guests are happy so that you can do that even more. There is much you can achieve by just being better at collecting and using feedback.
ICA Group is one of the largest retail companies in the Nordic countries. The stores focus on groceries with a high level of service. They vary in size, from small ICA Nearby stores to large Hypermarkets that also have departments for fashion, entertainment, gardening and electrical products. Keeping up with the customer demand – with different geographical locations and varying sizes and target groups – is hard with only a general customer survey. GreatRate is used to pin point local areas to improve, adapted to the specific challenges in each store.
The ICA Group uses GreatRate for two main purposes.
1. Identify local customer needs.
2. Monitor satisfaction level and find factors that needs to be improved.
For these two purposes the floorstand kiosk was chosen to collect the customers feedback instantly in the store.
Floorstand kiosks can be placed either at the exit or in specific departments of a store. When it comes to analyzing what the customers feel about the assortment a stand is usually placed in a specific department, for example Fruit and vegetables, Bread, Soda or Dairy products. A general question comes first, for example: “How satisfied are you with our Fruit and vegetables department?”. A second page, with factors to rate, is optional. This makes the survey experience good for every respondent. In this case 53% of the respondents choose to go to the second page. Compared with a survey that only has one question, a GreatRate survey gets far more actionable data, and in this case the store owner wants to know what to improve which makes this method perfect. The factors are: Availability and filling, Ecologic alternatives, Fresh look and Assortment. A common result in this department is that the factor Fresh look needs to be improved. Something that is automatically analyzed and reported to the store manager at a chosen time or interval.
In some stores, that serve warm meals during lunchtime, other questions are asked. The manager wants to know what the customers think – what needs to be improved? In this case there is also an in-depth analysis to pin point exactly how to improve the warm meals. A floor stand kiosk is placed at the heating cabinet where the meals are. The first page asks: “How satisfied are you with our warm meals?”. The factors on the second page are: Portion size, Menu, Variation of meals and Price. After a few days the manager gets the result that shows which factor to improve. To mention an example of improvement let’s look at a case where Menu and Variation of meals was pointed out. The store manager wanted to know what to change in the menu and specified the survey. The following days the first question was changed to: “How satisfied are you with the menu and variation of meals?”. The factors on the second page were: Meals from different parts of the world, Vegetarian alternatives, Standard local dishes, Hot food and Exclusive food. In this case “Standard local dishes” was pointed out as the factor to improve. Adding that to the menu gave more satisfied customers.
To measure overall satisfaction and what to improve a floor stand is placed at the exit. The first question is: “How satisfied are you with your visit?”. The factors on the second page are: Staff service at checkout, Waiting time at checkout, Staff service inside the store, Staff availability inside the store and Easy to find what I’m looking for. The manager can follow the trends each day and find times that need attention. To communicate easily to the staff the Action plan is used at the beginning of every week. It gives the staff a common goal and improves productivity and customer satisfaction. During special circumstances this Action plan can point out a factor that normally isn’t in need of improvements, but is currently impacting negatively. In these stores factors regarding “Staff availability” and “Staff service” are the most common priorities. Therefore there are a lot of cases with in-depth surveys regarding those factors. Here are two examples:
This example is about giving the staff the right thing to improve. Page one: “How satisfied are you with the Staff service?” Factors on page two: Available staff to ask, The staff paid attention to you inside the store, The staff was easy to contact and Did you get help with your errand? This is automatically analyzed and reported and leads to quick improvements.
The second example is about finding where in the store faster service is needed. Page one: “How fast do you get service from our Staff?” Factors on page two: At the checkout, In the self service checkout, In the mail delivery and Inside the store. The report clearly shows where to take action.