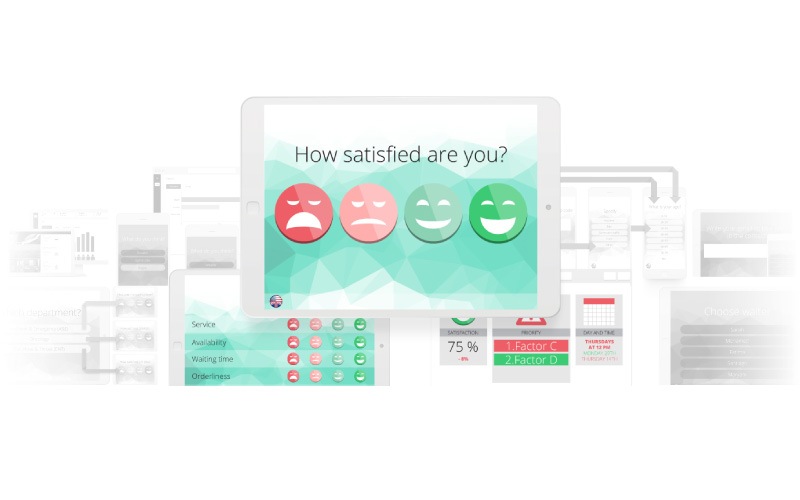
With the goal to increase satisfaction you need to know why the respondents are happy or not. In eight seconds you get both overall satisfaction and ratings of your chosen factors. Is it for example the service, the waiting time or the availability that needs attention?
The second page is optional to give every respondent a positive survey experience (and continue to give feedback when they return) and with this approach you will in average get 50% to give the detailed ratings that are deeply analyzed. This unique GreatRate method automatically sends action plans ready to use at the staff meeting. It points out which factor has the highest priority right now. There is no need for interpretation – get right into action.
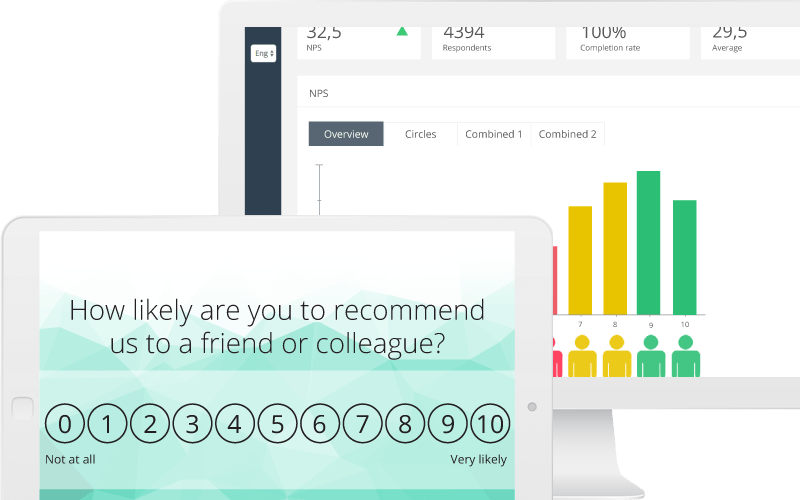
Beside the unique GreatRate method described above, another popular scale is the Net Promoter Score (NPS). It asks the question “How likely are you to recommend us to a friend or colleague?”. The scale is 0-10 and only the top 9 and 10 are considered positive. This makes NPS a powerful way of making sure the results show people who would actually recommend your brand.
This method works well if NPS is your current standard. In most cases we recommend you to use this in combination with a deeper analysis that GreatRate enables with for example ratings of more specific factors.
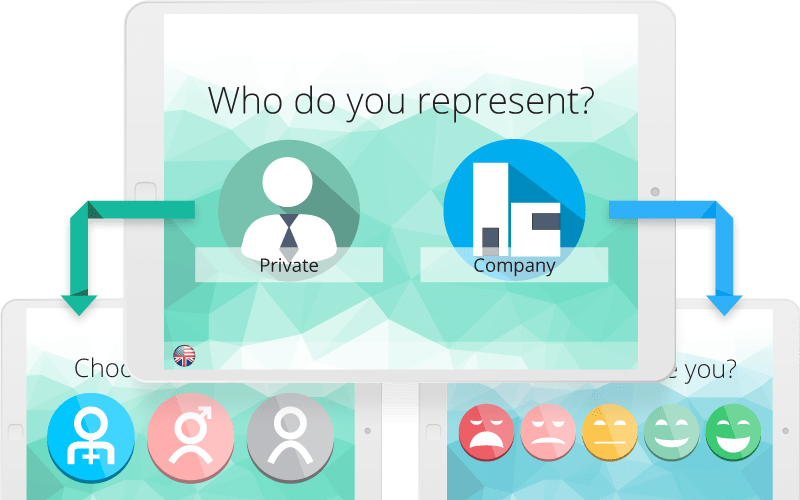
GreatRate can be adapted to different environments where feedback from different target groups is collected.
You can either use simple segmentation to give different surveys to each target group. Or you can use a more advanced question logic where a specific question is showed only to the respondents that meet a required pattern of responses. For example you could let the dissatisfied respondents clarify their experience. In any case the admin system gives you full control and overview over the different paths.
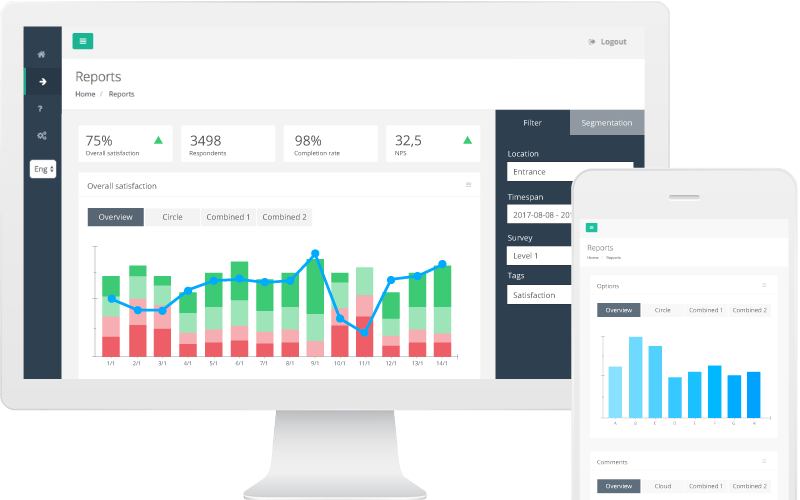
Reach all data instantly in the fast and flexible cloud based admin – wherever you are, on your computer or mobile. Create surveys with ease and use our vast range of charts to view the results.
The segmentation panel lets you pick the correct time span, collection point and survey. You can even use each option in the survey to filter the results. For example you can show answers specifically from dissatisfied respondents. An adaptable hierarchy will work for any team size and the user specific access gives the structure your team needs.
Our reports are carefully designed to suit your needs. The most powerful report on the market is the Action plan that uses deep analytics to interpret the results for you, and present effective priorities. This one is especially suited for presenting to your team, engaging and taking action.
Automatic daily, weekly, monthly and yearly reports can also be used for quick summarizes.
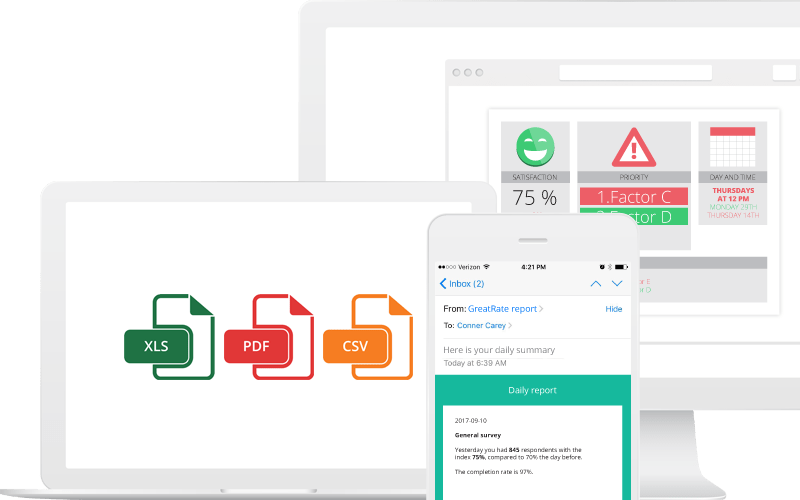
The exporting functions are vast, and let’s you segment the results the way you like it. You can also choose between different file types, such as Excel, PDF and CSV depending on if you will present them right away or integrate with other systems.
Customer satisfaction, loyalty and experience is the top priority at most businesses and organisations. You want the customers to revisit you, be happy to pay more for your products or services, choose you although it might be a longer road and recommend your brand to others. The most important keys for your success.
There are big changes going on. Today we see much more interest in what the customers think, feel and act. Why is that? There are many ongoing changes on the market and even in our society. To mention a few we can start with communication. The network each person has now extends beyond thousands and sharing an opinion now reaches far more than ever. This is a fundamental change, and even more important because a negative shared opinion has 12 (twelve!) times the effect than a positive shared opinion. It can lead to disaster.
What about the dissatisfied customers that are less talkative but still walk out your door and never come back? They are a big loss since it costs up to 7 (seven!) times more to acquire new clients than it does to retain the ones you already have. So how will you keep them loyal enough to come back?
Products look more and more alike. Prices are already too low in many markets. You need to focus on keeping them satisfied with their experience – and you have a lot of opportunities to impact that. How you handle service, waiting time, information and other factors will be crucial for success.
Another vital change is the speed of information. Yearly and monthly surveys belong in the past. Today information is about being updated here and now, and for that there is a need for better, faster and more intuitive collection points to easily understand the situation. Waiting too long to hear important opinions or to see the effect of your changes will only increase customer churn.
So what can you do? You need more than revenue numbers, traffic analysis and other KPIs. Be better informed about customer satisfaction and make better decisions. And don’t wait for actionable insight, those revenue numbers and fulfillment goals depend on it. Bring clarity to what needs attention right now. Our users state that when you get proof of a negative impact – even if you could already imagine it – you dare to act on it and fulfill goals faster. And sometimes the insight will be new – the sharpest tool to stay ahead of your competitors.
IKEA is the world’s largest furniture retailer. With a huge number of visitors every day, keeping up with their opinion can be a challenge. At an IKEA store the customer experience is everything. From the moment you park the car, until you have checked out and left the area, every step is important.
IKEA uses GreatRate for two main purposes.
1. Measure satisfaction level, and get instant knowledge of how to increase or maintain it.
2. Lower cost of showroom building, and increase sales with analysis of what the customers rank as more important to focus the layout around.
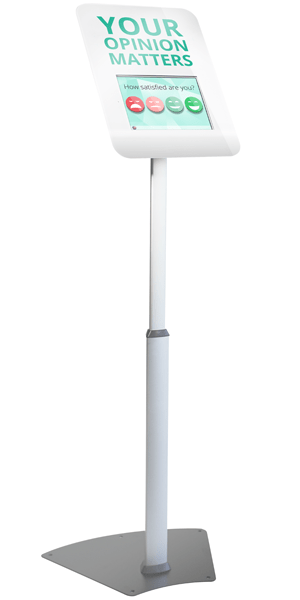
For these two purposes the floorstand kiosk was chosen to catch the customers feedback on the go.
There are two main areas where the collection of satisfaction level is implemented:
At the exit, and in the self-serve area.
First let’s look at the question asked at the exit: “How satisfied are you with your visit?”. To this question there is a page two, in the survey, added where optional factors are rated. The average percentage of people that are willing to complete the two pages are 42% of the total respondent group. Compared with a survey that only has one question, a GreatRate survey gets far more actionable data – and leaves every respondent happy with the survey experience. The factors in this case are: Value for money, Product quality, Clean and tidy, Staff service and Easy to find what you are looking for. Supervisors follow trends each day, and once a week they follow the Action plan sent to their email. They show the Action plan to the staff, and it clearly points out the factor to focus on that week. This awareness creates a common goal and increases performance.
Sometimes they want to know more details of how they should improve a factor. They either change the survey that week, or start a parallel survey that alternates in the floorstand. This new survey is equally fast and pleasant to answer, with an overall question and 3-5 factors. They often do this the last week every month.
Let’s look at two examples:
– When they decide to explore the customers’ satisfaction with the Staff the first question is: “How satisfied are you with the staff?” (Sometimes added with “in this department?”). The factors are: Availability, Paid attention to you, Service, Helpfulness and Knowledge of your question. The analysis and Action plan points out the factor to focus on, making the staff work on the right thing to increase the overall satisfaction.
– When they need to focus on how easy it is to find the right products the first question is: “How easy is it to find what you came here to purchase?” (Sometimes added with “in this department?”). The factors are: Enough information on the product, Staff availability, Waiting times and The product is in stock. The analysis points the staff in the right direction.
To add to the understanding the customers can write with their own words what they want to improve.
In the Self-serve area the factors are: Easy to find your product, Easy to bring your product with you, Staff availability and The goods were in stock. In this specific case the analysis clearly shows that Easy to find your product is the main priority, giving improvements in display and information about where to find the products.
Let’s look at targeted surveys in the showrooms. They use the same method with an overall question and optional factors, but a floorstand is placed in each showroom. By analyzing factors like Smart solutions, Style, Storage, Environmental thinking and Lighting one conclusion was made that the most important factors to improve overall in the showrooms were Smart solutions and Style. Except in the bedroom where Storage had a much greater impact.
Following these conclusions, the team responsible for showroom building, have a greater knowledge of how to build showrooms that speaks to the customers and make them a more likely buyer.
These findings – and very specific analyzed data – were never before seen within IKEAs organization.
In a specific case about the awareness about services they asked the question: “How well have we informed about our services?”. The factors were: Financing, Help to gather goods, Home transport, Installation of kitchen/bathroom and Interior decoration. The information and awareness about Financing had to be improved.