International Clients
Local Clients
Collect fast feedback
Case study
Type: Retail
Respondents: 17 768/month
Completion rate: 42%
“As a store manager at IKEA, I encountered different customer research tools throughout my career, but GreatRate differs from everything else. It’s the only tool that comes with a complete priority analysis, which makes all the difference!”
MARTIN LIABÄCK
(FMR.) STORE MANAGER
CLIENT CASE: IKEA
IKEA is the world’s largest furniture retailer. With a huge number of visitors every day, keeping up with their opinion can be a challenge. At an IKEA store the customer experience is everything. From the moment you park the car, until you have checked out and left the area, every step is important.
IKEA uses GreatRate for two main purposes.
1. Measure satisfaction level, and get instant knowledge of how to increase or maintain it.
2. Lower cost of showroom building, and increase sales with analysis of what the customers rank as more important to focus the layout around.
For these two purposes the floorstand kiosk was chosen to catch the customers feedback on the go.
MEASURE SATISFACTION – AND TAKE ACTION
There are two main areas where the collection of satisfaction level is implemented:
At the exit, and in the self-serve area.
First let’s look at the question asked at the exit: “How satisfied are you with your visit?”. To this question there is a page two, in the survey, added where optional factors are rated. The average percentage of people that are willing to complete the two pages are 42% of the total respondent group. Compared with a survey that only has one question, a GreatRate survey gets far more actionable data – and leaves every respondent happy with the survey experience. The factors in this case are: Value for money, Product quality, Clean and tidy, Staff service and Easy to find what you are looking for. Supervisors follow trends each day, and once a week they follow the Action plan sent to their email. They show the Action plan to the staff, and it clearly points out the factor to focus on that week. This awareness creates a common goal and increases performance.
Sometimes they want to know more details of how they should improve a factor. They either change the survey that week, or start a parallel survey that alternates in the floorstand. This new survey is equally fast and pleasant to answer, with an overall question and 3-5 factors. They often do this the last week every month.
Let’s look at two examples:
– When they decide to explore the customers’ satisfaction with the Staff the first question is: “How satisfied are you with the staff?” (Sometimes added with “in this department?”). The factors are: Availability, Paid attention to you, Service, Helpfulness and Knowledge of your question. The analysis and Action plan points out the factor to focus on, making the staff work on the right thing to increase the overall satisfaction.
– When they need to focus on how easy it is to find the right products the first question is: “How easy is it to find what you came here to purchase?” (Sometimes added with “in this department?”). The factors are: Enough information on the product, Staff availability, Waiting times and The product is in stock. The analysis points the staff in the right direction.
To add to the understanding the customers can write with their own words what they want to improve.
In the Self-serve area the factors are: Easy to find your product, Easy to bring your product with you, Staff availability and The goods were in stock. In this specific case the analysis clearly shows that Easy to find your product is the main priority, giving improvements in display and information about where to find the products.
HOW TO LOWER COST, AND MAKE SHOWROOMS MORE ATTRACTIVE
Let’s look at targeted surveys in the showrooms. They use the same method with an overall question and optional factors, but a floorstand is placed in each showroom. By analyzing factors like Smart solutions, Style, Storage, Environmental thinking and Lighting one conclusion was made that the most important factors to improve overall in the showrooms were Smart solutions and Style. Except in the bedroom where Storage had a much greater impact.
Following these conclusions, the team responsible for showroom building, have a greater knowledge of how to build showrooms that speaks to the customers and make them a more likely buyer.
These findings – and very specific analyzed data – were never before seen within IKEAs organization.
OTHER USES
In a specific case about the awareness about services they asked the question: “How well have we informed about our services?”. The factors were: Financing, Help to gather goods, Home transport, Installation of kitchen/bathroom and Interior decoration. The information and awareness about Financing had to be improved.
Type: Grocery store
Respondents: 28 478/month
Completion rate: 53%
“We have used GreatRate for over three years now, Great tool to get a daily and easy follow-up on customer and employee satisfaction!”
EMIL REMRÖD
STORE OWNER
CLIENT CASE: ICA
ICA Group is one of the largest retail companies in the Nordic countries. The stores focus on groceries with a high level of service. They vary in size, from small ICA Nearby stores to large Hypermarkets that also have departments for fashion, entertainment, gardening and electrical products. Keeping up with the customer demand – with different geographical locations and varying sizes and target groups – is hard with only a general customer survey. GreatRate is used to pin point local areas to improve, adapted to the specific challenges in each store.
The ICA Group uses GreatRate for two main purposes.
1. Identify local customer needs.
2. Monitor satisfaction level and find factors that needs to be improved.
For these two purposes the floorstand kiosk was chosen to collect the customers feedback instantly in the store.
IDENTIFY LOCAL CUSTOMER NEEDS
Floorstand kiosks can be placed either at the exit or in specific departments of a store. When it comes to analyzing what the customers feel about the assortment a stand is usually placed in a specific department, for example Fruit and vegetables, Bread, Soda or Dairy products. A general question comes first, for example: “How satisfied are you with our Fruit and vegetables department?”. A second page, with factors to rate, is optional. This makes the survey experience good for every respondent. In this case 53% of the respondents choose to go to the second page. Compared with a survey that only has one question, a GreatRate survey gets far more actionable data, and in this case the store owner wants to know what to improve which makes this method perfect. The factors are: Availability and filling, Ecologic alternatives, Fresh look and Assortment. A common result in this department is that the factor Fresh look needs to be improved. Something that is automatically analyzed and reported to the store manager at a chosen time or interval.
In some stores, that serve warm meals during lunchtime, other questions are asked. The manager wants to know what the customers think – what needs to be improved? In this case there is also an in-depth analysis to pin point exactly how to improve the warm meals. A floor stand kiosk is placed at the heating cabinet where the meals are. The first page asks: “How satisfied are you with our warm meals?”. The factors on the second page are: Portion size, Menu, Variation of meals and Price. After a few days the manager gets the result that shows which factor to improve. To mention an example of improvement let’s look at a case where Menu and Variation of meals was pointed out. The store manager wanted to know what to change in the menu and specified the survey. The following days the first question was changed to: “How satisfied are you with the menu and variation of meals?”. The factors on the second page were: Meals from different parts of the world, Vegetarian alternatives, Standard local dishes, Hot food and Exclusive food. In this case “Standard local dishes” was pointed out as the factor to improve. Adding that to the menu gave more satisfied customers.
MONITOR SATISFACTION – AND FIND THE RIGHT ACTION
To measure overall satisfaction and what to improve a floor stand is placed at the exit. The first question is: “How satisfied are you with your visit?”. The factors on the second page are: Staff service at checkout, Waiting time at checkout, Staff service inside the store, Staff availability inside the store and Easy to find what I’m looking for. The manager can follow the trends each day and find times that need attention. To communicate easily to the staff the Action plan is used at the beginning of every week. It gives the staff a common goal and improves productivity and customer satisfaction. During special circumstances this Action plan can point out a factor that normally isn’t in need of improvements, but is currently impacting negatively. In these stores factors regarding “Staff availability” and “Staff service” are the most common priorities. Therefore there are a lot of cases with in-depth surveys regarding those factors. Here are two examples:
This example is about giving the staff the right thing to improve. Page one: “How satisfied are you with the Staff service?” Factors on page two: Available staff to ask, The staff paid attention to you inside the store, The staff was easy to contact and Did you get help with your errand? This is automatically analyzed and reported and leads to quick improvements.
The second example is about finding where in the store faster service is needed. Page one: “How fast do you get service from our Staff?” Factors on page two: At the checkout, In the self service checkout, In the mail delivery and Inside the store. The report clearly shows where to take action.
Type: Hotel
Respondents: 2102/month
Completion rate: 56%
“GreatRate modernizes and simplifies, especially with the way to analyze what is important to the guest, and point it out quickly. And also, they clearly keep the highest level.”
KERSTIN NILSSON
HOTEL MANAGER
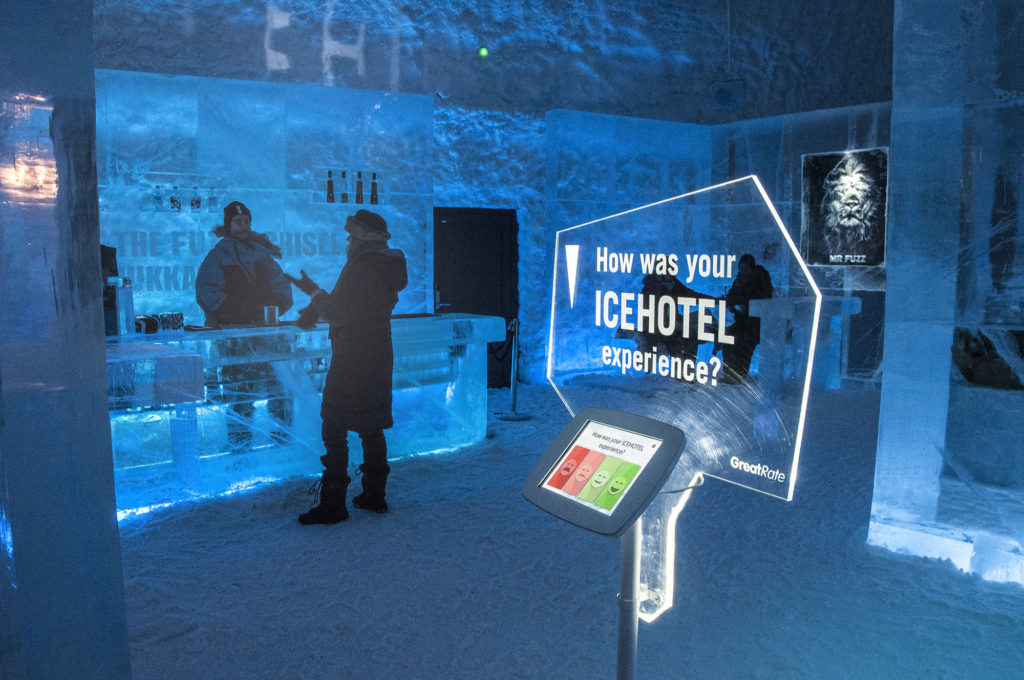
CLIENT CASE: ICEHOTEL
The world famous ICEHOTEL is a hotel made of ice in northern Sweden, with parts being rebuilt each year. Kings and queens come and visit, along with those from all over the world who have saved money all their lives to finally experience the unusual attraction. It is important to know their needs to stay at the top of the line.
ICEHOTEL uses GreatRate for two main purposes.
1. Increase overall satisfaction with the hotel.
2. Make the restaurant experience better.
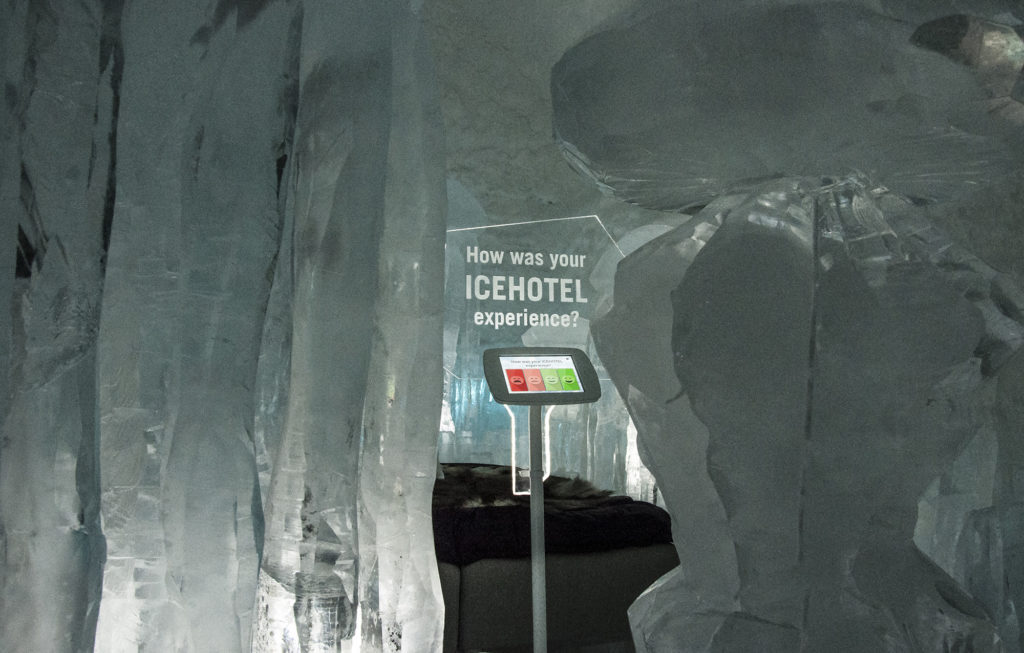
To measure satisfaction ICEHOTEL uses uniquely designed floorstand kiosks.
HOTEL SATISFACTION
The floor stands are placed at the front desk and in specific departments. The first question is: “How was your ICEHOTEL experience?”. The respondent then gets the option to go to a summarized page with short factors to rate. Since it is optional the survey experience is good for every respondent. The average percentage of people that are willing to complete the two pages are 56% of the total respondent group. The factors on the second page are: Staff service, Art, Atmosphere, Activities and Orderliness. At the start of every week the head of each department communicates an Action plan to the staff members, who take immediate action. The manager also follows the trend for each day.
The hotel manager Kerstin Nilsson explains the staffs’ role in increasing satisfaction:
– We have unusually loyal staff members. No matter if they serve drinks at the ice bar, stand at the front desk or are head of a department they enthusiastically tell stories about the northern lights or the creation of the art suites. But we are only human and without the guests opinions something could gradually get worse – without us noticing it. Maybe we make a small mistake the same time each day. The one who stops improving, actually gets worse. That’s why we need a quick way of finding the right things to improve. GreatRate makes this so easy, thanks to the analysis that points out what is important to the guests, and fast.
RESTAURANT SATISFACTION
With a lot of international guests, the food experience is important and exciting. Before using GreatRate, ICEHOTEL made their own paper surveys that they put on each table in the restaurant. They weren’t able to do this all the time, so it had to be only specific, shorter, periods. The guests answered a couple of questions and then it was up to the manager to go through all the answers and find a pattern.
Replacing this with tablets and a floor stand made all the difference. They follow the trends for overall satisfaction and specific factors. The ongoing survey has these factors: Staff service, Menu, Facilities, Orderliness and Atmosphere. The weekly Action plan shows which factor to improve.
GreatRate is also used to improve the food in detail. Some days the main question is “How satisfied are you with the food?” with these factors: Seasoning, Vegetarian options, Heat, Color and Presentation. The guests can also write their own thoughts. The analysis then shows in detail what to improve.
GreatRate is ICEHOTELs’ main tool for maintaining quality and finding new ways of getting more satisfied guests.
Type: Wholesale & Warehouse
Respondents: 1584/month
Completion rate: 73%
“In the work with GreatRate, we discovered that it is incredibly useful for so much more than just measuring satisfaction, it’s a truly amazing tool!”
PETTER KARLSSON
PRODUCTION MANAGER
CLIENT CASE: MARTIN & SERVERA
Martin & Servera is a distributor for restaurants and caterers with over 2 900 employees. The warehouses are exciting and challenging workplaces, organizing millions of products. Listening to employees and keeping a fluent teamwork is important to maintain a good workplace – and being able to deliver to thousands of customers.
Martin & Servera uses GreatRate for four main purposes.
1. Measure satisfaction and finding areas that needs to be improved.
2. Measure the on-boarding process for new employees.
3. Measure quality of products.
4. Finding bottlenecks in production.
Martin & Servera uses floorstand kiosks to collect daily feedback from their employees.
MEASURE SATISFACTION – AND TAKE ACTION
The routine to improve employee satisfaction has two parts:
1. Identifying a factor that needs improvement
2. Get deeper insight in the prioritized factor for better improvements
First, let’s look at identifying a factor. Martin & Servera measure employee satisfaction daily. The floor stands are placed at the time clocks where every employee pass at the end of every day. The survey has two quick pages. The first asks about overall satisfaction: “How satisfied are you with your workday?”. On the second page they rate the following factors: Feedback from production leader, Workflow, Security, Teamwork and I know what is expected of me. The analysis – which is reported in an Action plan to easily communicate the results – identifies which factor has most negative effect and needs to be improved.
Secondly, the employees discuss the prioritized factor and splits it in five factors. They want to know how to best approach the problem. Take for example the factor Feedback from production leader. It is split into: Coaching, Present in production, Information, Trust and The leader pays attention to me. For a few days the first question is: “How satisfied are you with the feedback from your production leader?”. And the second page shows the specific factors. The analysis then shows which factor is the reason behind dissatisfaction. Getting a clear conclusion and solving a problem is fast and effective.
If the production leader then wants even more detailed feedback, the survey can dig deeper into one of the factors. Take Coaching for example – how is it best improved? It is split into the following factors: Equal treatment, Motivates teamwork, Developing my skills, Take part in the work itself and Has knowledge. In one specific case the conclusion was to prioritize the factor Developing my skills, which led directly to a better workplace.
The employees are engaged in the questions and factors in the survey, keeping them motivated to give feedback continuously. The daily feedback is also used to follow trends and find times that need attention. Even though the overall satisfaction shows the overall trend, 73% of the respondents complete the entire survey which is the base for deeper analysis. This is a clear and powerful method to gain higher employee satisfaction fast. And they learn a lot on the way which builds a foundation for a lasting, stable workplace.
ON-BOARDING PROCESS
New employees rate their introductions on floorstands or tablets that are passed around. This helps the company identify what needs to be improved. For example Information, Clarity, Activities, Tempo or Teamwork.
QUALITY OF PRODUCTS
When handling perishable goods the staff can register the quality of the goods, and draw important conclusions. They can thereby handle them better and keep track of the suppliers standards.
FINDING BOTTLENECKS
Collecting feedback on different times and in different parts of the process gives a total overview of what works and what needs to be improved.
Type: Hospitals & Clinics
Respondents: 36 895/month
Completion rate: 79%
“Measuring visitor satisfaction is even more important today because the views spread like wildfire. Our goal is to have a satisfied and confident visitor who wants to come back. We need local tools designed to achieve it. GreatRate collect our otherwise fragmented focus.”
SANDRA BJÖRK
CUSTOMER RELATIONS
CLIENT CASE: SWEDISH HEALTH CARE
The Swedish health care system is one of the best in the world. It is mainly managed in regions spread out over the entire country. Several of these regions along with private clinics use GreatRate to listen to their patients. Their goal is to identify factors that needs to be improved, but since the system contains so many departments and units traditional surveys have been lacking in pointing out exactly where to take action.
Those regions and clinics use GreatRate for two main purposes:
1. Measure satisfaction level separately in different departments and take action adapted to the local needs.
2. Ensuring lasting positive effects by local in-depth questions and routines.
For these two purposes the floorstand kiosk was chosen to collect the patients feedback.
MEASURE SATISFACTION SEPARATELY – AND TAKE LOCAL ACTIONS
With specific placement and questions departments and units can follow specific groups of respondents, to get better insight on where to take action. Here are three examples of local surveys.
Let’s begin with a dermatology (skin) clinic that continuously follow up an overall question: “How satisfied are you with your visit?” and then gives the respondents the option to go to a second page. The average percentage of patients in this case that are willing to complete the survey is 79%. Since it is optional the survey experience is always good, and compared to a solution with only one question, a GreatRate survey gets much more actionable data. The second page shows five factors that the respondent rates. These are the factors: Information and preparations, Waiting time, I feel listened to, I understand the plan for my care and Staff behavior. The clinic manager uses an Action plan each week, that is automatically emailed as a pdf and easy to communicate to the staff. It points out the factor to improve, and follows up the satisfaction trend. This gives the staff a common goal and ensures high quality in the care.
The next example is from the Pediatric care, where children and their parents visit. They use the same logic, with an overall question on the first page: “How satisfied are you with your visit?” and then a second page with local factors: The planning of my childs’ care, Staff behavior, I felt involved, Clear information and Waiting time. This is also summarized in an Action plan each week to ensure quality. Notice that this example have the factor: “The planning of my childs’ care” and the first example had the factor: “Information and preparations” as local factors.
Another example that stands out is this survey where the floor stand kiosk is placed directly outside of the room where samples are taken. The first question is: “How satisfied are you with the taking of samples?” and the factors on the second optional page are: Gloves and hand sanitizer, Staff behavior, Information and preparations, Waiting time and I feel listened to.
LOCAL IN-DEPTH ACTIONS AND ROUTINES
Here are two examples of in-depth surveys adapted entirely for giving detailed knowledge about a specific group of people.
First let’s look at how the psychiatry department work with their results. They have an ongoing survey with basic questions, and in their routine they decide to make in-depth surveys one week per month. Both the basic survey and the in-depth survey have the same amount of questions to ensure the survey experience is always good. The in-depth survey depends on the automatic analysis of the basic survey. This basic survey looks like this. Page one: “How satisfied are you with your visit to this department?”. Page two has these factors: I felt involved, Staff behavior, I got the help I needed and I understand the plan for my care.
– When the Action plan points out for example “I felt involved” as the factor to improve, the in-depth survey is started. Page one: “How involved did you feel during your visit?”. Page two has these factors: I felt understood and respected, We talked about the right things, The therapists’ work method suited me and The conversation tempo. The conclusion makes the team make the correct improvements. Then they go back to the basic survey and repeat the routine with fresh feedback. This completes their ongoing work with maintaining quality and increasing satisfaction.
Secondly let’s look at the rehabilitation unit and how they adapt their surveys. Their basic survey looks like this. Page one: “How satisfied are you with your visit to this department?”. Page two has these factors: The activities suited me, Did the visit matter to the bettering of your health?, Staff behavior, Staff availability and I felt the visit was meaningful.
– In a specific case the Action plan pointed out “The activities suited me” as the factor to improve. They decided to make an in-depth survey. Page one: “How satisfied are you with the activities?”. Page two had these factors: Full day activities on wednesdays, Short activities on thursdays, Standard weekly activities and Garden activities. The right improvement was to change the “Full day activities on wednesdays”, something they wouldn’t have done without collecting feedback and making an in-depth survey.
OTHER EXAMPLES
GreatRate is used in many forms of specific projects. Here we mention a few.
A common goal is to get better understanding of the patients. In patient-centered care the patients involvement in the care plan is a main factor. With this as a focus in-depth surveys about their involvement are made, with the first question: “How satisfied are you with your care plan?”. The factors on page two are: I have participated in discussion regarding the care plan, I have the possibility to tell what I want about myself, I can be a part of deciding the goals of my care and I know what I can do myself to get closer to the goal.
At several regions a project called “Correct applied competence” is meant to make sure new knowledge and technologies are being used in the best way possible. When using GreatRate the staff are the ones giving feedback. They rate the workday and then factors in relation to their competence: The tasks suited my profession, I have cooperated with my profession, Communication in the team and Teamwork. The analysis then points out which factor to improve.
The staff in some parts of the Swedish health care system also rates parts of their own tasks. For example how well it worked to perform the bedside report. They rate the overall impression and the following factors: The patient was involved in the report, The time frame was kept and I had enough information. The analysis then shows if there is any factor that prevents the staff to do a good job.
Another interesting project is called “Smart Elderly”. The goal is to use technology to improve the elderlys’ lives. GreatRate is their main tool to collect feedback and an unusual survey was made, with the aim to find in which area of theirs lives they would benefit the most emotionally to be technologically helped. These factors were analyzed: Personal care, Movement, Reminders and alarms, Home care and Communication/social life. We are happy to present the conclusion: The elderly are most emotionally positive to be technologically helped in Communication/social life.

Type: Congress
Respondents: 850/day
Completion rate: 100%
“We wanted one tool to serve all our needs, booth to create activity and interaction with our visitors and at the same time we wanted to meausure how satisfied they are. GreatRate does it all.”
VASSO NORLUND
ADMINISTRATOR
CLIENT CASE: NATIONAL VETERINARY CONGRESS
The National Veterinary Congress gathers the top specialists in animal care, members from veterinary clinics, insurance companies and scientists. The congress consists of nearly a hundred seminars and lectures spread out over five main halls and also contains a fair that showcases news from the industry. To ensure both attendees and sponsors are satisfied they use GreatRate to collect feedback during the event.
The National Veterinary Congress uses GreatRate for four main purposes.
1. Identify which parts of the seminar program need to be improved – the place and time.
2. Monitor satisfaction level live to make instant improvements.
3. Analyze which factor of the entire event that had the highest impact for long term improvements.
4. Engage participants with live polls.
For the three first purposes the floorstand kiosk was chosen to catch the attendees feedback. For the live polls smartphones are used. At the opening speech everyone is informed on how to give feedback during the event.
IDENTIFY PLACE AND TIME
One or more floor stand kiosks are placed at the exits of each main hall. In this way the managers know the location of the collected feedback. By using GreatRate’s scheduling function the question(s) automatically change to address the specific seminar at the right time. With this information they can compare how well different parts of the program are rated, and what to focus on.
MONITOR SATISFACTION LIVE
The managers don’t want to wait with an improvement if there is a possibility they can make a change instantly. Directly after parallel seminars are rated, they can go to the place with the lowest rating and solve the problem.
LONG TERM IMPROVEMENTS
At the end of the entire event the floorstand kiosks are placed at the exit, to capture everyones feedback regarding overall satisfaction and five factors. On the first page the question is: “How satisfied are you with the congress?”. On page two they rate these factors: Program, Speakers, Activities, Fair and Staff. It is optional to write their own suggestions. The analyzed result shows which factor had the greatest impact on both the satisfied and the dissatisfied respondents. With this information they know what they need to improve until next time – and what they should keep doing to have satisfied attendees.
Collecting feedback at the time of the experience has advantages compared to a survey days afterwards.
LIVE POLLS
The National Veterinary Congress uses live polls to interact with the attendees. Since the congress is about science and new knowledge live questions like: “Which method do you think is the most effective?” or “What do you think is the pet owners’ main concern when their animal is sick?” adds to the experience. They are given 3-5 options to choose from. The results are instantly shared on the projector screen, and the correct (and often surprising) answer is then revealed. With their own smartphones the participants go to the event page and open the live seminar link.
Type: Golf Club
Respondents:1 258/month
Completion rate: 51%
“We’ve had great benefit from GreatRate. The feedback can be followed up immediately and we can see the change day by day. We can control our own survey and tailor it to our business. In real-time, we find out what to improve and what parts are our strengths. A Very easy-to-use and affordable tool”
JAN MONIER
CLUB MANAGER
CLIENT CASE: BRÅVIKEN GOLF CLUB
Bråviken Golf Club market themselves proudly as The Friendly Golf Club. They have taken extra steps to suit every players need. For example added extra tees for juniors and beginners, made the course obstacles more varied and upgraded the caterer in the restaurant. They have courses that fit everyones need, an advanced practice area and thanks to wonderful nature and an impressive club house even hosted weddings. Keeping up with the golfers opinions on the different parts is not an easy task with old methods. With GreatRate they can monitor the satisfaction continuously and prioritize the right improvements.